


Stringency index vs tests in Covid-19: Country level analysis of Europe
All data come from covid.ourworldindata.org / focus on European countries

This is a follow up to my previous post: Stringency vs deaths in Covi-19 European countries.
Although deaths are the ultimate important thing (and the post above shows that statistically, links between stringency index and new deaths / million are rather weak…), to complete the picture i redo an identical analysis but with new tests / million
The idea is to look into statistical relationships (or no relationships) between stringency index (check post above for link to description of what is this thing) and new tests per million by country in Europe
Again, at a country-level: Y = daily variations in new tests per million and X = stringency index (lagged by 30 days)
I will provide scatter plot + linear fit (and R²) and results for coefficients from 30 days rolling window regressions
For some countries, available data is not sufficient to perform the entire analysis, therefore i present only what was possible to achieve with available data for the complete analysis (no cherry picking!)
Let me present you the coefficients’ plot for each country available: coefficients beta are the output from regressing Y on X (defined above) using OLS with robust standard errors; these are further used to plot the linear fits on the scatter plots hereafter
Remember that these coefficients are from regressing all observations; we obtain an “average” (linear by hypothesis) sensitivity measure for the whole year for each country
I present plots for East and West Europe:


Coefficients are close to 0, meaning “on average” the (linear) link between Y & X is very weak. Notice huge CI for some countries, reflecting important “volatility” in the data. A few countries have a <0 coefficient => negative correlation between stringency and new tests, i.e. considering the 30 days lag in X, then “causally”, more stringency => less new tests…
Now let’s dive in into results for some countries: i will show graphics for the “outliers”, i.e. with largest CI
All graphics are available under this link: https://icedrive.net/1/0atUAjMQD3 or on my GitHub
I present each time the scatter plot + linear fit & the evolution of the beta over time based on a rolling window regression
Here is Czechia:

Linear fit is flat, R² ~ 0, nothing to see here…
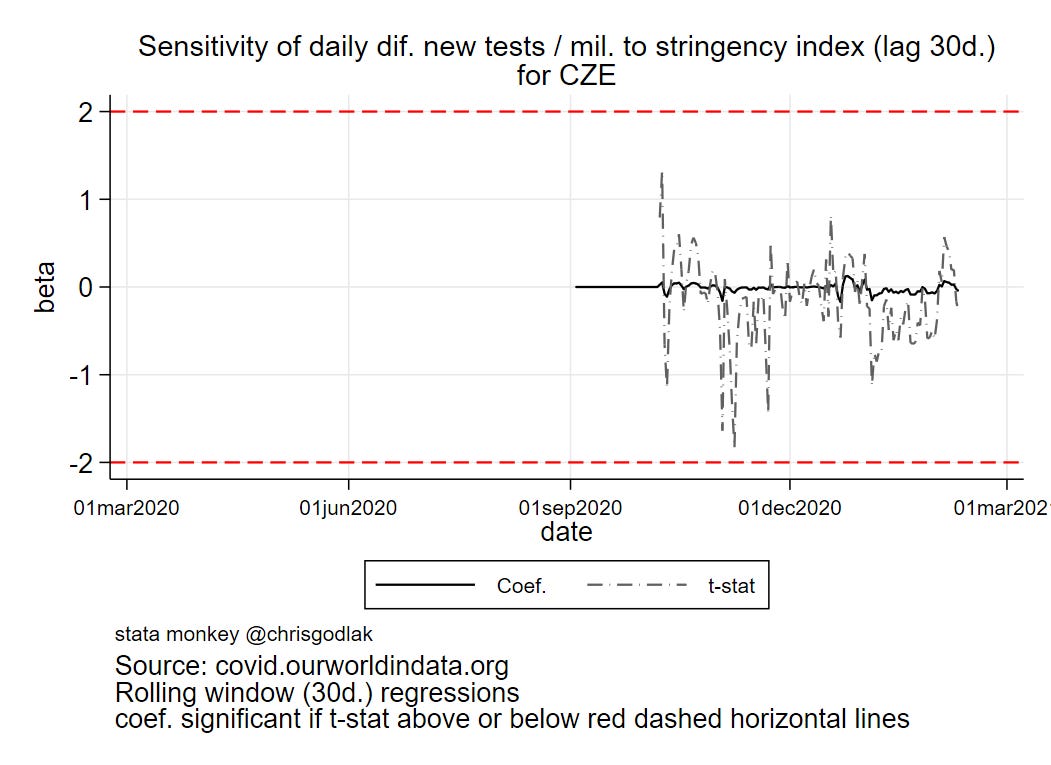
Over time, beta is close to 0, with some ups and downs, but nothing significant anyway…
Let’s do Belarus now:

Stringency index is low, linear fit has a negative slope, R² at 2%…

Beta coefficient around 0, significant around june, but still, it is around 0…
Let’s do Slovenia:
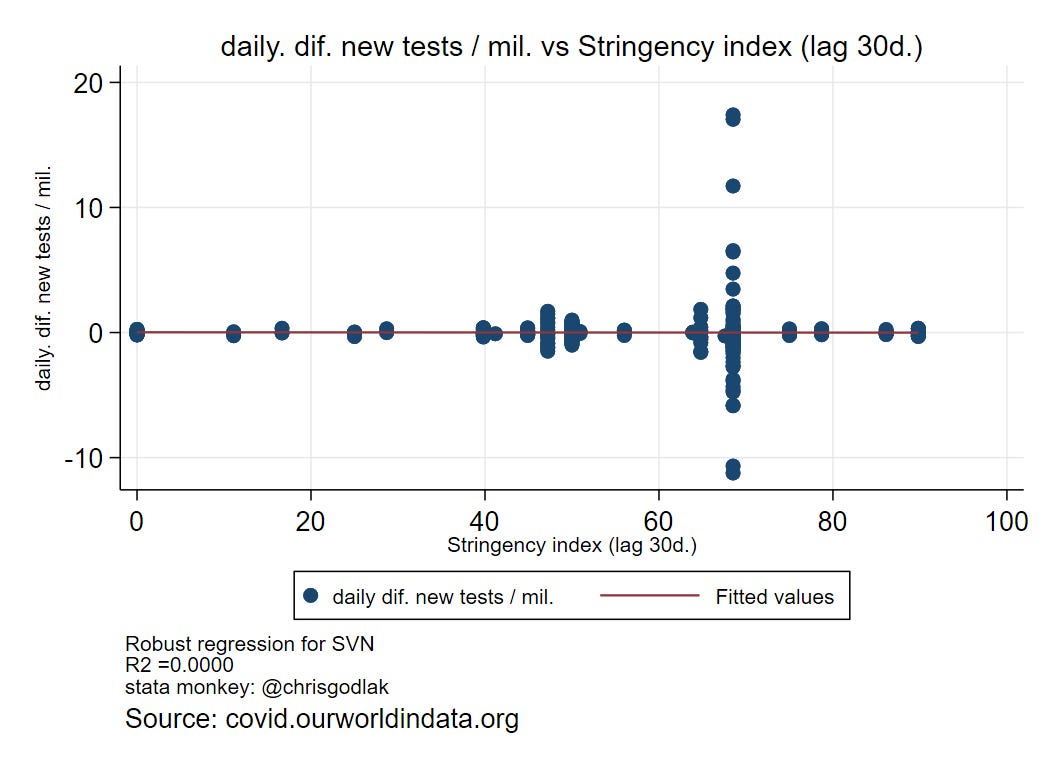
Flat with R² at 0….

Beta around 0 over time, 1 huge spike in fall, and actually positive :D meaning that stringency (lagged) is positively related with testing…
Let’s go to Western Europe now, starting with Austria:
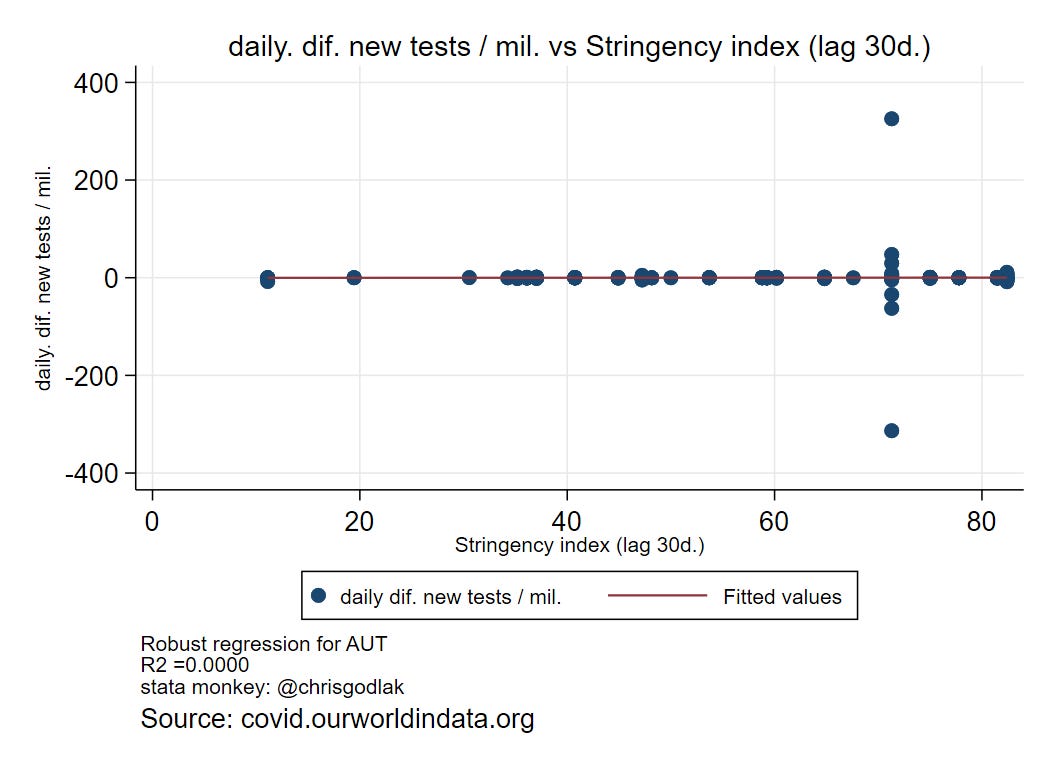
Flat, R² = 0

Beta around 0 over time, with a huge (positive !) spike in fall… notice the downside spike later on but not significant…
Luxembourg:
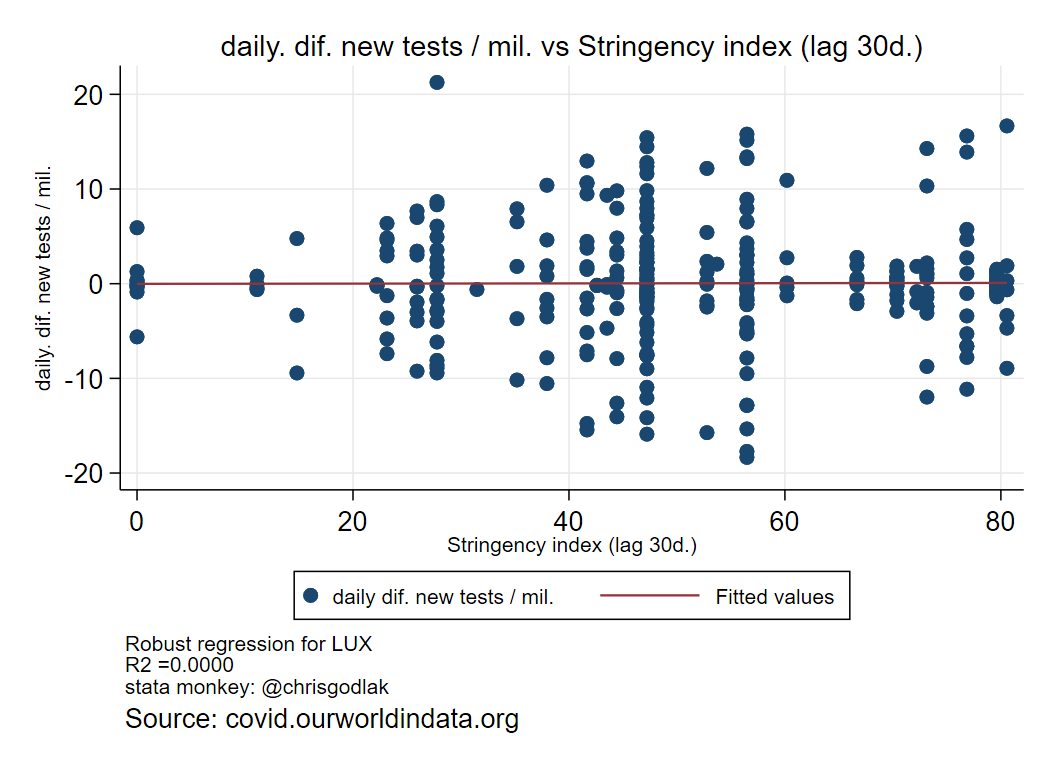
Flat, R² = 0

Beta round 0 with some upticks in winter but not significant; notice positive and then negative significance for beta close to 0 in summer…
And finally Iceland:

Flat again, R² = 0

Beta around 0 again, significant (and negative) in summer, that’s it
Overall, links between stringency & tests are very weak: “on average” over the period and over time as well…