


Total deaths vs covid-19 stringency in Europe
Data sources: Eurostat & Oxford Covid-19 Gov. Response Track

What are the statistical relationships between total weekly deaths and ‘covid-19’ stringency measures in European countries?
After analyzing the relationships between covid-19 deaths and stringency measures here: https://godlak.substack.com/p/stringency-index-vs-deaths-in-covid-c35 I focus this time on total deaths
All data come from Eurostat (for deaths: https://ec.europa.eu/eurostat/data/database?node_code=demomwk) and from Oxford Covid-19 Government Response Tracker (OxCGRT) (for stringency measures: https://github.com/OxCGRT/covid-policy-tracker)
The stringency index measures government responses, such as school closing or restrictions on public gatherings. The higher the index, the more stringent is the governement response.
Deaths & stringency evolution over time
First, let’s look at the evolution of deaths and stringency index over time by country. I “divide” European countries according to their average total weekly deaths since 2020:

A first group is composed of the largest (most populated) countries with large total deaths:

Spain, France & Italy have nearly perfect alignment of both curves, with the largest spikes in spring… For Poland & Romania, stringency starts “killing” in winter only, but had no effect in spring. Germany is similar to to Poland or Romania.

A second group of countries (“medium” ones) shows various patterns…

The third and last group (“small” ones) is also heterogenous w/r to both curves…
Let’s look at the scatter plots & linear fits now: i represent for each country the relationship between total weekly deaths and the weekly average stringency index, lagged by 2 weeks (“2 weeks to flatten the curve”). All graphics are available here: https://icedrive.net/1/30AFeKbpoy
I will present here only the first 6 large countries:
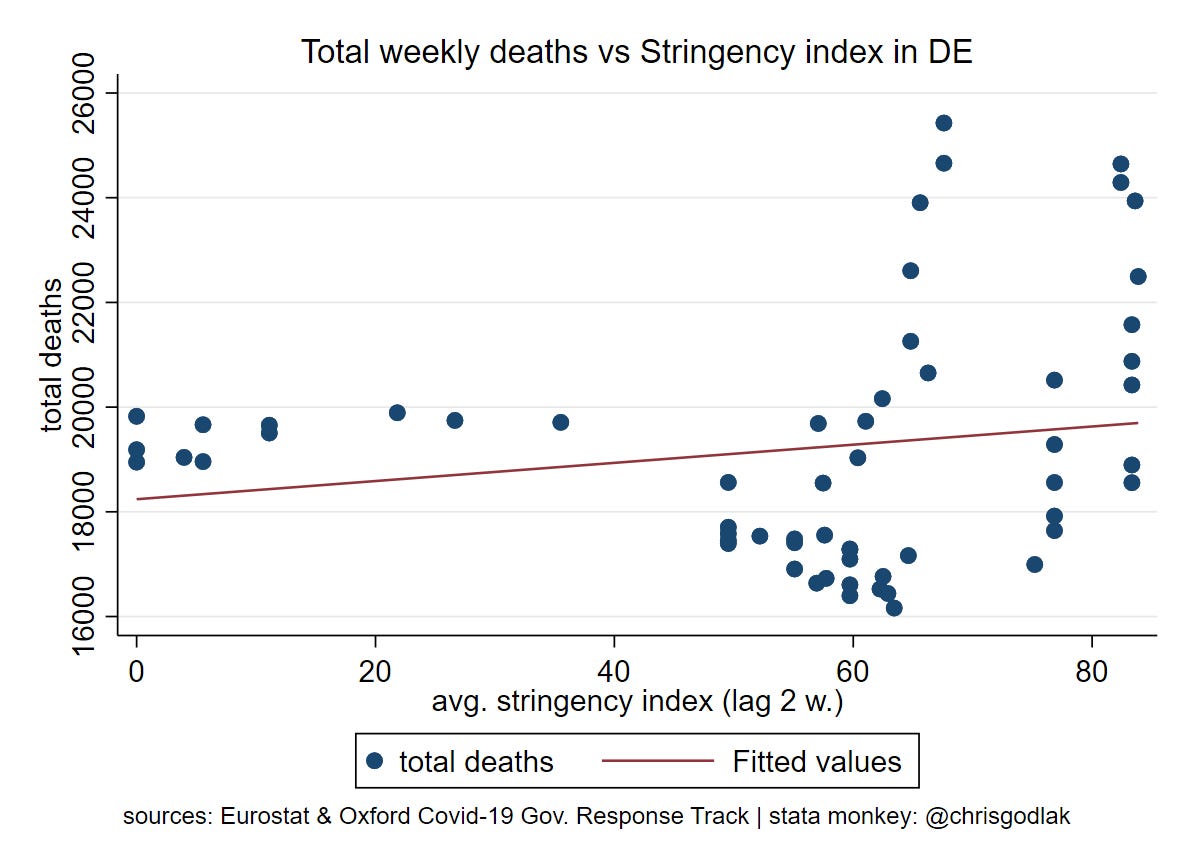


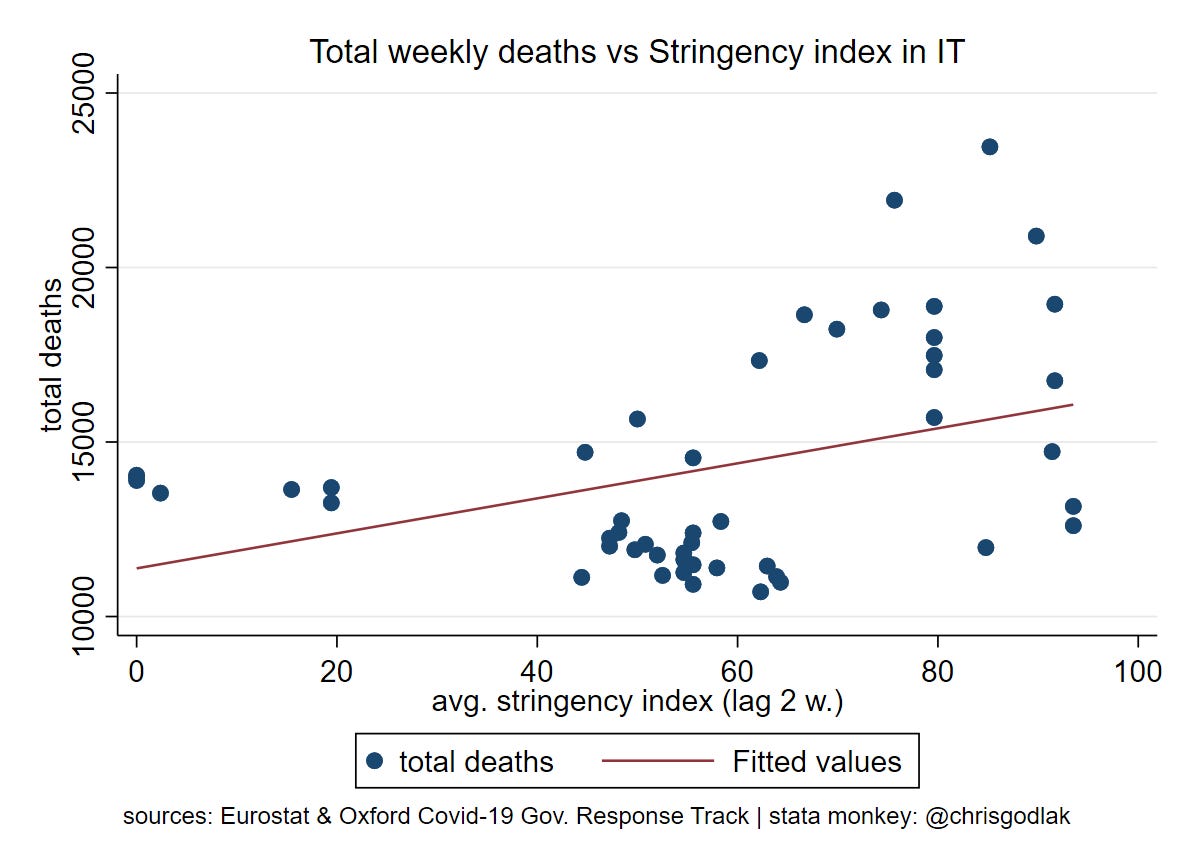


Overall, the linear fit (which is of course not perfect when looking at the shapes of the dots) is rather ascending, i.e. more stringency associated with more total deaths.
Regressions results
I perform linear regressions (with robust standard errors) by country where y = total weekly deaths and x = average stringency index (lagged by 2 weeks) + monthly dummies (control for time, i.e. seasonality). The coefficients obtained will represent a linear “average” of the sensitivity of total weekly deaths to lagged stringency index over the entire period under investigation (2020 + up to week 9 of 2021).

Regarding the largest 6 countries, 4 out of 6 coefficients are significant: Italy, France, Spain & Romania. These coefficients are all positive, except for Romania (with a residual value). If i take the example of the largest significant & positive coefficient (Spain), increasing stringency index by 1 unit is associated with an increase of more than 100 total weekly deaths 2 weeks later.

Regarding the “medium” countries, we observe several significant coefficients, both positive and negative. Croatia, Bulgaria, and Hungary can achieve up to -10 weekly total deaths for a 1 unit increase of the stringency index. Belgium or Netherlands increase their total weekly deaths by 20 following a 1 unit increase in stringency index.
Overall, the average coefficients that are statistically significant are positive, i.e. more stringency is associated with more total deaths…
Rolling window regressions
Previous regressions are “static” as they “synthetize” the entire period. Another perspective is to consider sub-periods, by performing a rolling window regression on rolling period of 4 weeks for instance to capture the dynamic of the relationship over time. Technically speaking, the same model is employed as above but the coefficients are estimated on rolling windows of 4 weeks.
I present here the results for the 6 largest countries, all graphics are available here: https://icedrive.net/1/30AFeKbpoy

For Germany, the sensitivity of total deaths to stringency is sometimes positive and sometimes negative. Notice the most recent positive spike, linked to the recent increased stringency.

For Italy, we notice a huge negative spike around week 15 of 2020 (begining of march), then a fluctating sensitivity… This correlates with the easing of the stringency index…

For France, no important impact of the initial lockdown but then we notice a spike before week 40 (end of september) immediatly followed by an important plunge. This period correlated with the second lockdown… We also notice a increasing curve for the recent period.
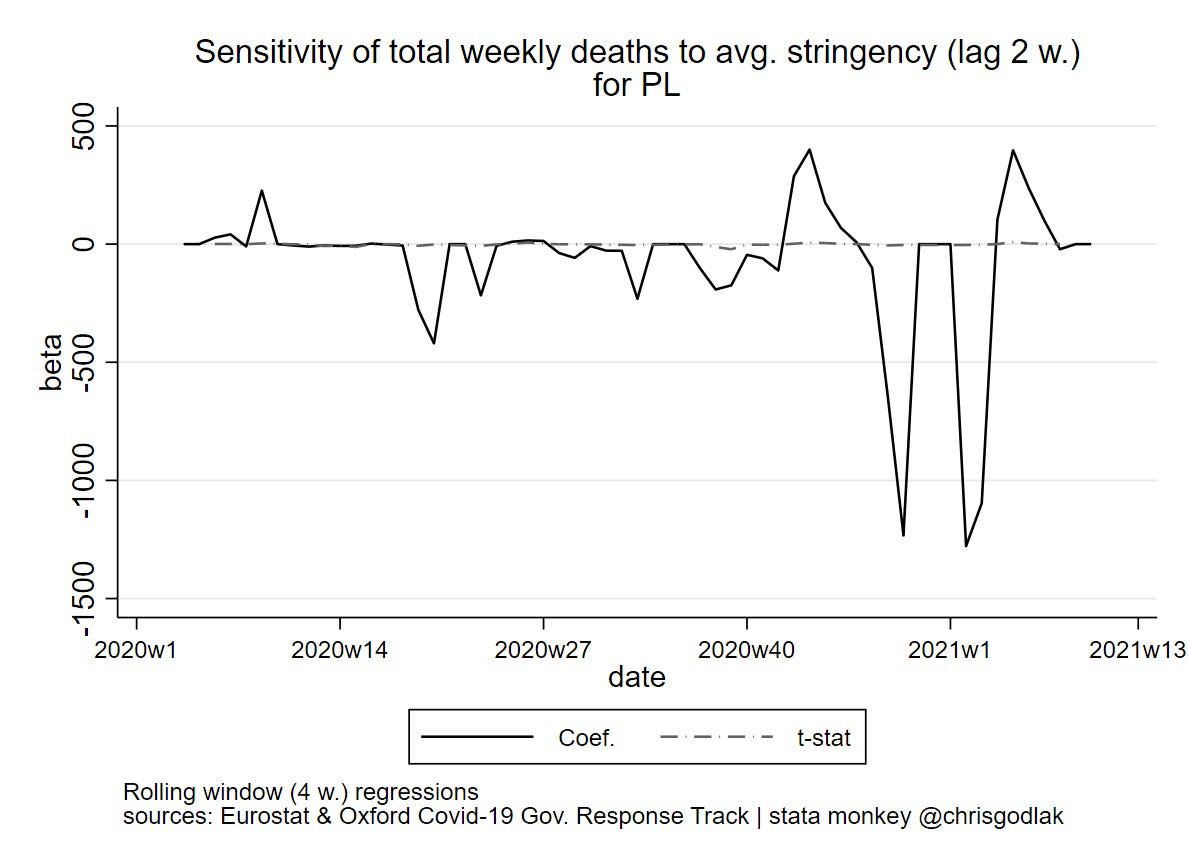
For Poland we notice several negative spikes but in fall we observe an initial positive spike, followed by a yoyo effect with massive plunges, and another positive spike at the beginning of 2021. This period correlates with the fall/winter increased stringency…

In Spain we observe many positive spikes, 1 at the start of the lockdown in spring 2020, followed by a plunge and immediatly after a huge positive spike ! This correlates with the easing of the initial lockdown…

Finally, for Romania we notice a positive spike around june (?), then a plunge in the beginning of fall followed immediatly by a huge positive spike. This correlates with the fall/winter increased stringency.
Overall, it appears that stringency index may be positively correlated with total weekly deaths in the largest European countries…