


Covid-19: stringency index vs hospitalization & icu - country level analysis in Europe
All data come from covid.ourworldindata.org / focus on European countries

This is the last post that follows several previous posts with simple statistical/graphical analyses of links between stringency & various covid-19 metrics:
To get the big picture I suggest you check the previous posts :)
My analysis is identical to the previous ones: the general idea is to look into statistical relationships (or no relationships) between stringency index (check previous posts above for link to description of what is this thing) and hospitalizations & icus per million by country in Europe.
Again, i focus, at a country-level, on: Y = daily variations in hospitalizations or icus per million and X = stringency index (lagged by 30 days).
I show scatter plot + linear fit (and R²) and results for coefficients from 30 days rolling window regressions.
Disclaimer: for some countries, available data is not sufficient to perform the entire analysis, therefore i present only what was possible to achieve with available data for the complete analysis (no cherry picking!).
As usual, let me first present you the coefficients’ plot for each country available: coefficients beta are the output from regressing Y on X (defined above) using OLS with robust standard errors; these are further used to plot the linear fits on the scatter plots hereafter.
Remember that these coefficients are from regressing all observations; we obtain an “average” (linear by hypothesis) sensitivity measure for the whole year for each country.
I present plots for East and West Europe, hosp. & icu. respectively:

Unfortunately, data for East is missing, especially for icu, while it is better for West. We notice important heterogeneity in West, while most coefficients are < 0, i.e. negative link between stringency and daily variations in hosp. or icu. As stringency index is lagged by 30 days, one could go beyond and consider that higher stringency (e.g. lockdown) reduces daily var. in hosp. or icu. However, these coefficients are small in values. For East, we observe less heterogeneity w/r hosp., as most coefficients are aligned around 0, except for Lithuania with a < 0 coef. but a HUGE C.I. (!). Regarding icu. it is difficult to say as i end up with 5 countries only, but things look slightly heteregenous and coefficients are < 0. So overall it looks like stringency could reduce daily variations in hospitalizations & icus.
Now let’s dive in into results for some countries: i will pick up 2 “outliers”, i.e. with the most negative coef. with results available both for hosp. & icu.: 1 for West & 1 for East
All graphics are avaible here https://icedrive.net/1/afhU734RRy or here GitHub repo.
I present each time the scatter plot + linear fit (+ R²) & the evolution of the coefficient from a (30 days) rolling window regression.
Reminder: linear fit shape gives an indication if relationship is positive (positive slope) or negative (negative slope); R² tells if a linear fit captures well (high R²) or not (low R²) what is going on in the data (the link between Y & X); rolling window coefficient gives the link between Y & X over time; a positive “spike” means a positive link between Y & X (and by extension, as X = stringency is lagged by 30 days, that stringency => more hosp. or icu.), and a negative “spike” means the opposite.
Belgium:

Negative slope and R² at 23% or 32%
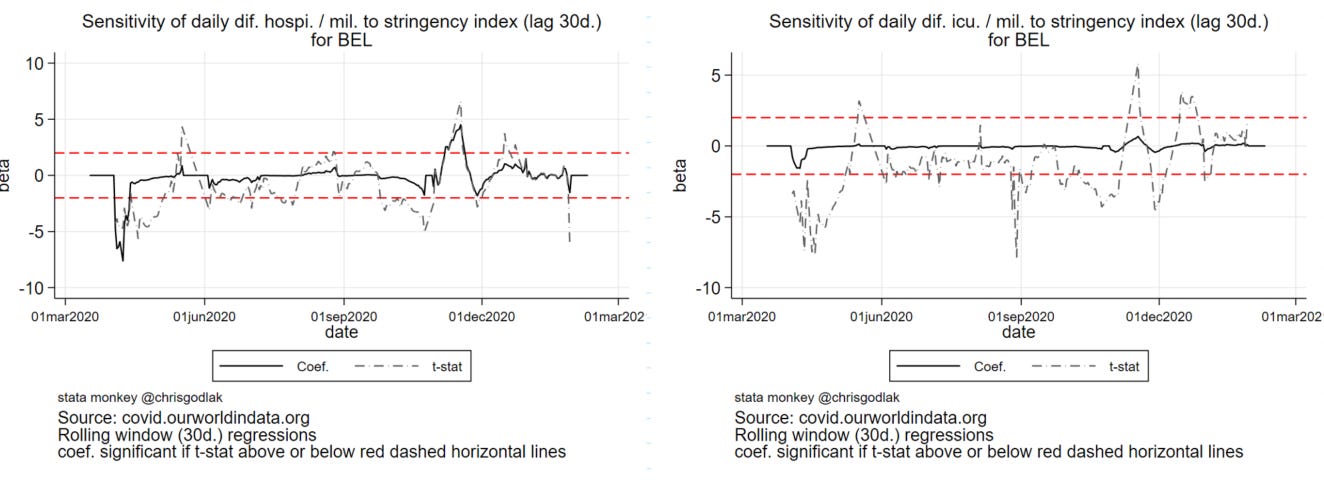
Coefficients over time are around 0 with some notable spikes for hosp. in spring (negative, i.e. “good for NPI”) and positive (i.e. “bad for NPI”) in winter
Bulgaria:

Slightly negative slope with low R² at 6.5% and 3.7% respectively
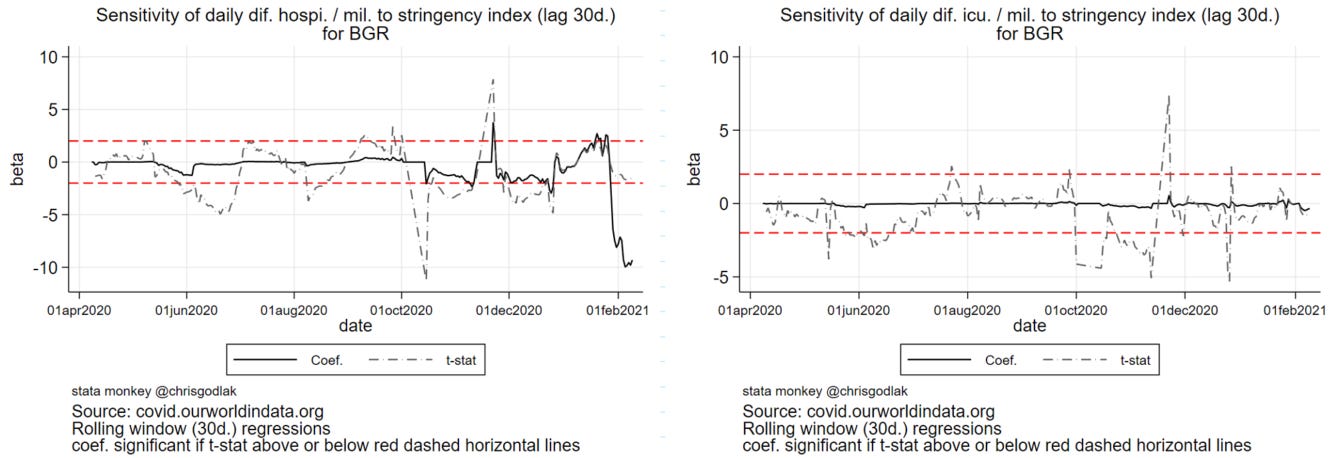
Coefficients around 0 over time except for hospi. in winter with both positive & negative spikes again
Overall, results for hosp. & icu. are the least weak w/r to other covid-19 metrics (such as cases or deaths); links are overall negative between stringency & hosp. or icu, R² are larger (2 digits) in West than in East; however, over time the coefficients are rather low and spikes are both positive (“bad” and NPI increase problems) and negative "(“good” and NPI decrease problems)…