


Stringency index and various 'Covid-19 metrics in Europe (part 2, with lags !)
Follow up but this time using lags for Stringency index (after smart comments on reddit)

All data come from covid.ourworldindata.org / focus on Europe
First analysis is here : https://godlak.substack.com/p/stringency-index-and-various-covid
Overall R² are very small; if we consider R² as a measure of how well a linear (i insist on LINEAR) fit allows to “capture” or “explain” a cloud of points (i.e. empirical observations) then the (linear) links or relationships between Stringency index and various ‘covid-19’ metrics in Europe are very weak…
But i used the contemporary values of Stringency index in first part; one can argue that stringency (e.g. lockdown) needs “time” to achieve its expected goals !
Therefore I replicate first analysis using Stringency index values lagged by 7, 14 and 21 days respectively w/r to “usual” covid-19 metrics: Reproduction rate, Positive rate, New cases per million, Weekly hospi. admission / mil., Weekly ICU admission / mil., New deaths / mil.
Each time i remind the R² from first analysis:
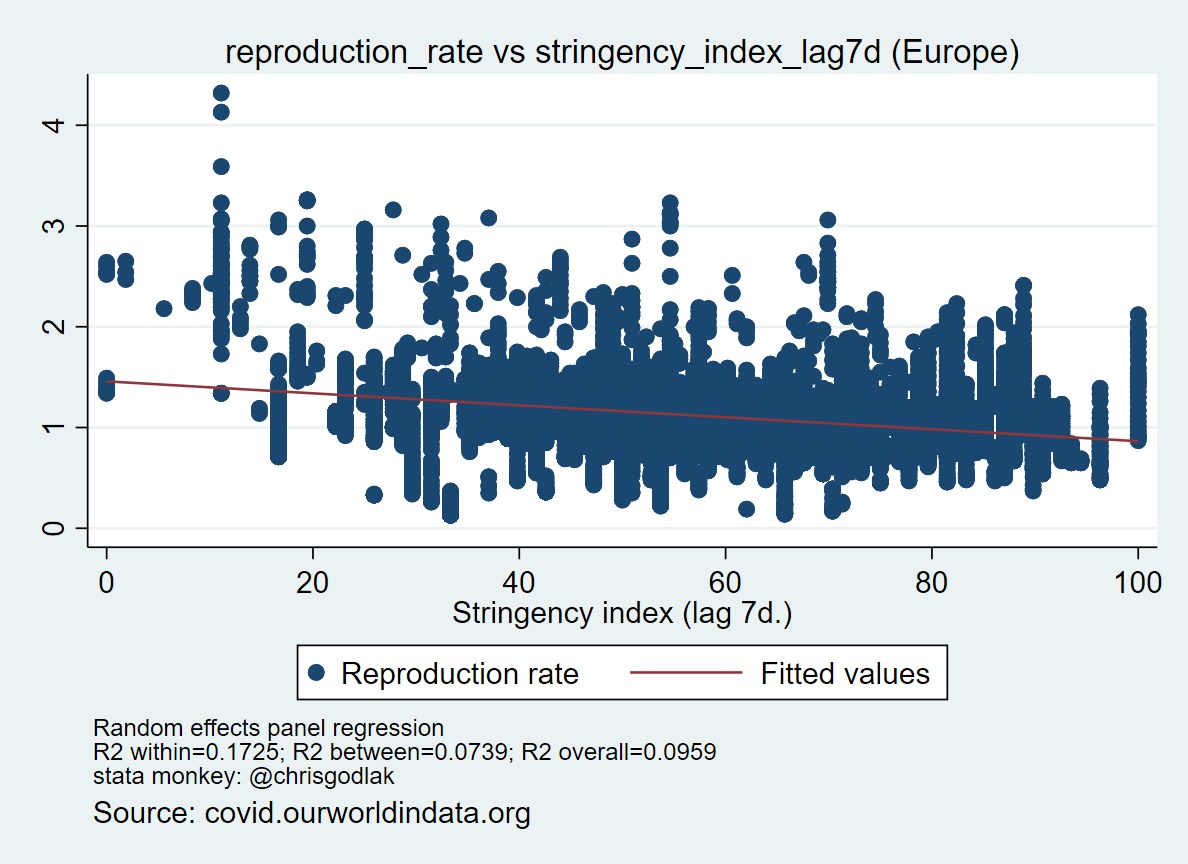
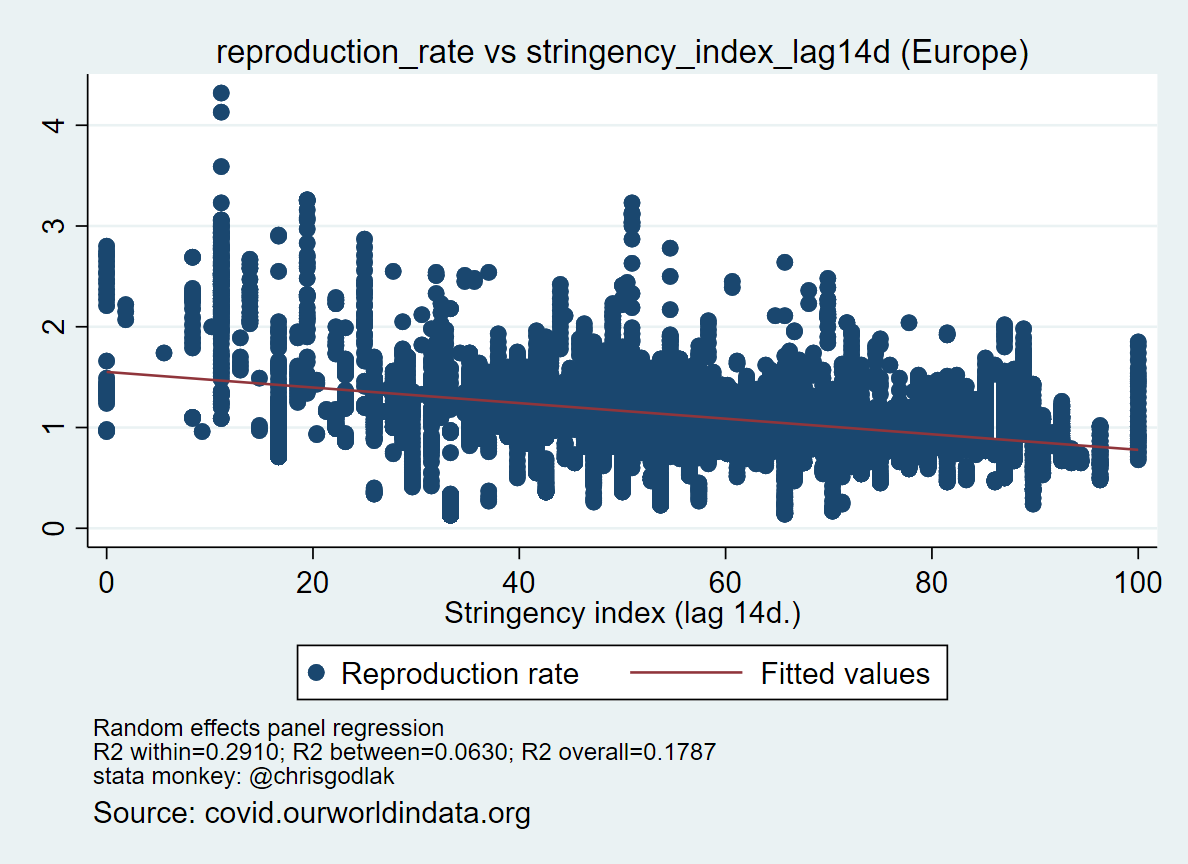
Reproduction rate vs Stringency index in Europe had an overall R² = 2.36%
With longer lags R increases up to 21%, almost x 10
So one could interpret that stringency measures (i.e. NPI) “need time” to make a (linear) link appear with reproduction rate (the “famous” R)
Remember that this R is strongly related to PCR intensity and positivity of PCR…

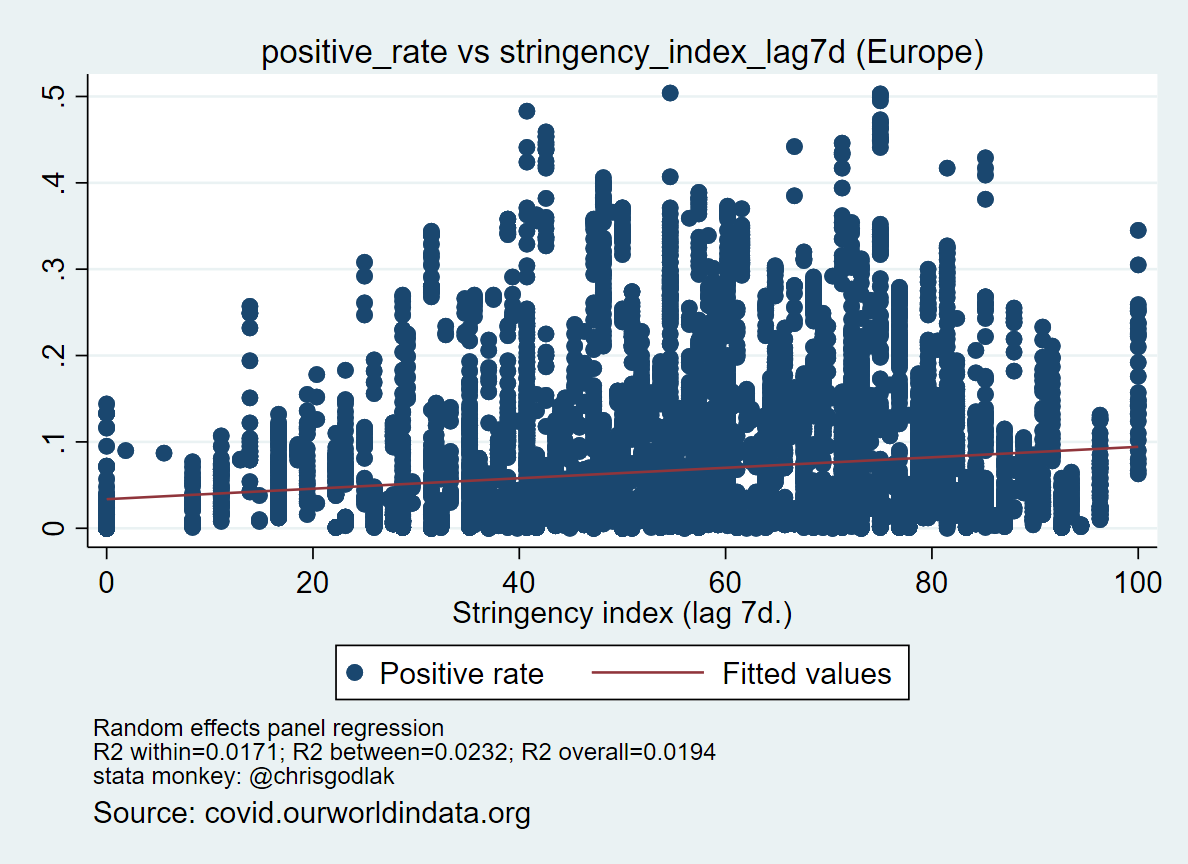
Positive rate vs Stringency index in Europe had R²=3.99%
Lags make it worst, as it goes down to almost 0 with 21 days lag for Stringency index
Here NPI measures are less and less “linearly” linked to % PCR+ with time… Notice that the fitted line becomes then flat…


New cases per million vs Stringency index in Europe, R²=1.09%
R² goes down to almost 0 with longer lags… which makes sense: if you lockdown humans for instance and also lockdown PCR centers you mechanically reduce “cases”… in that case you can claim lockdown works but the devil is in the details…


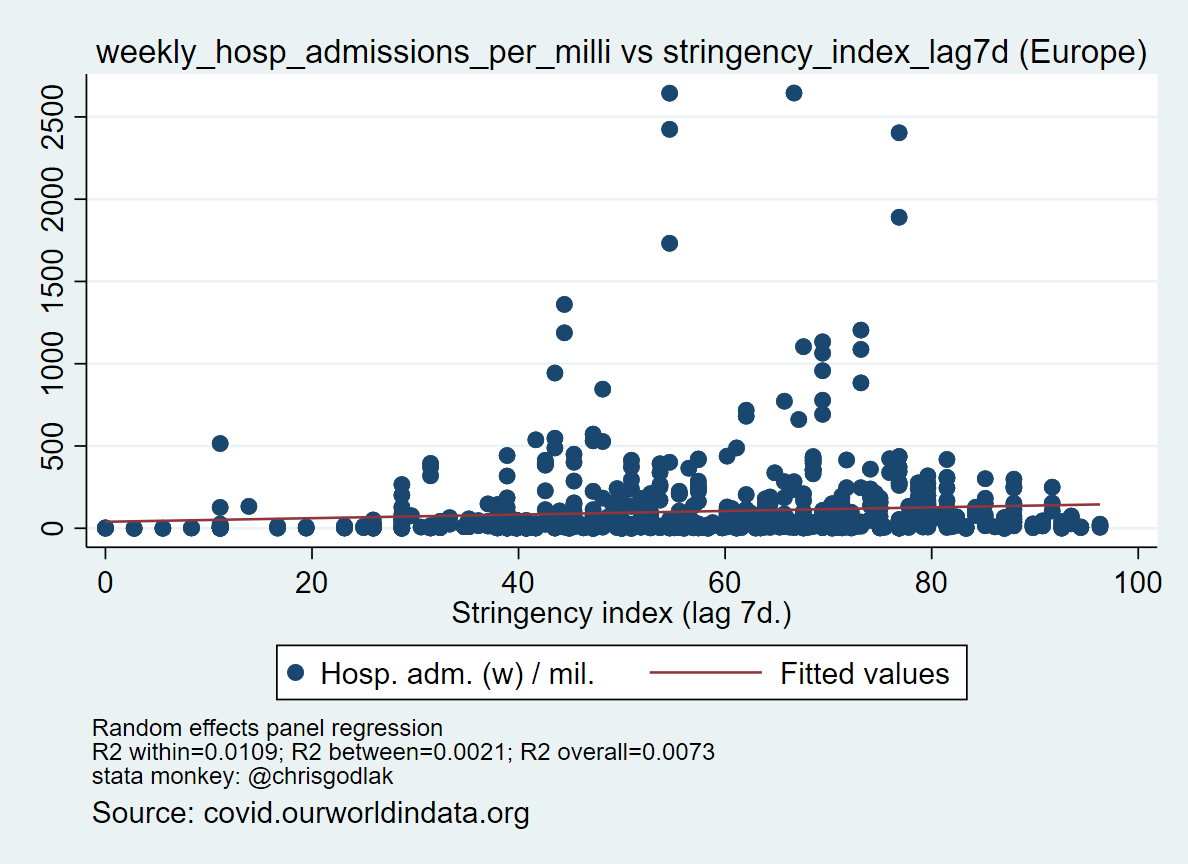
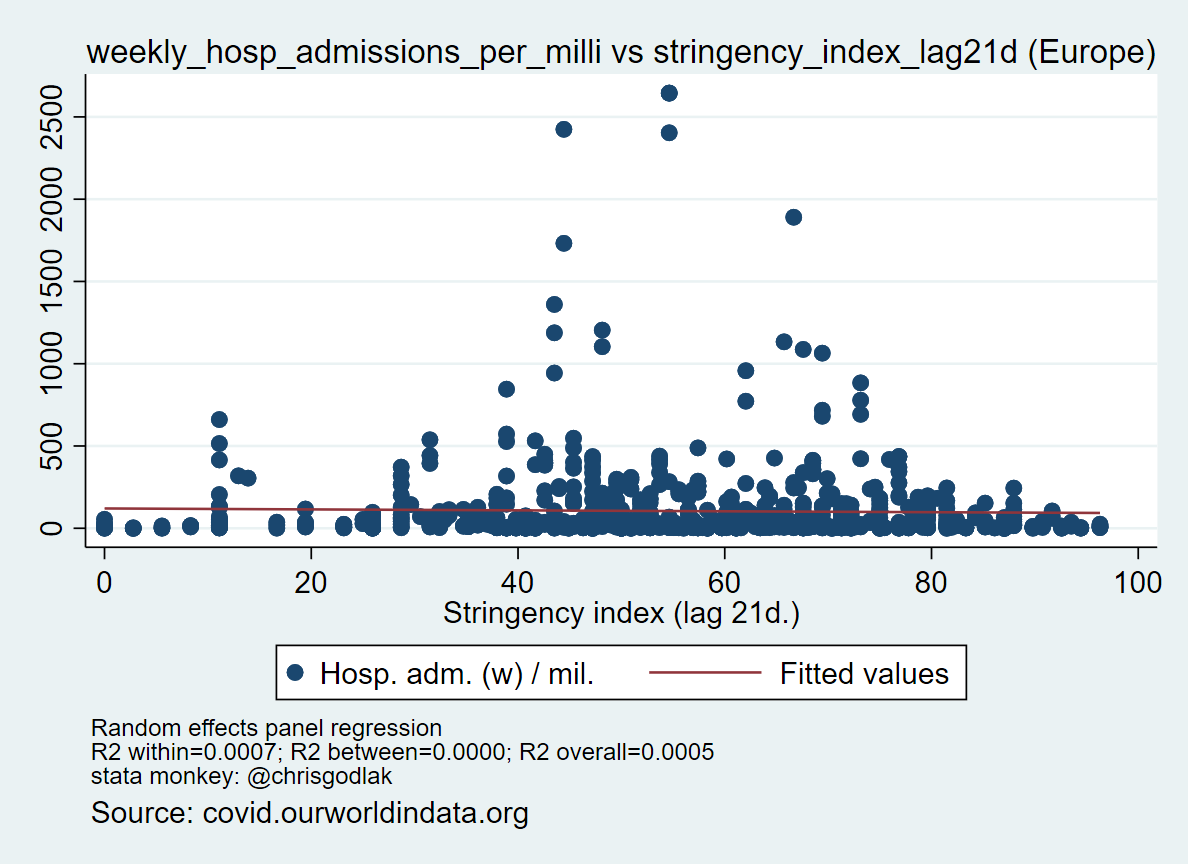
Weekly hospi. admission / mil. vs Stringency index in Europe, R²=1.52%
R² goes down to ~ 0 again; linear link between NPI measures and hospi. becomes inexistant over time…

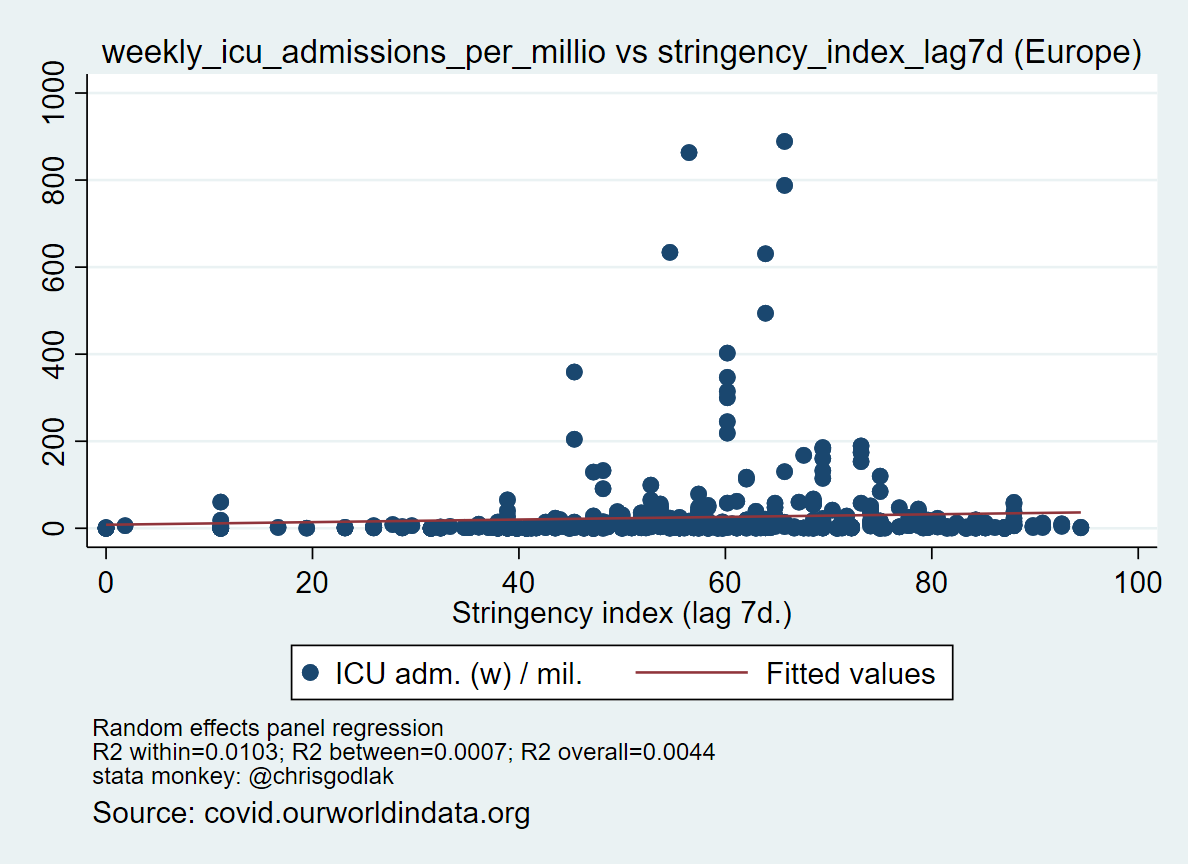
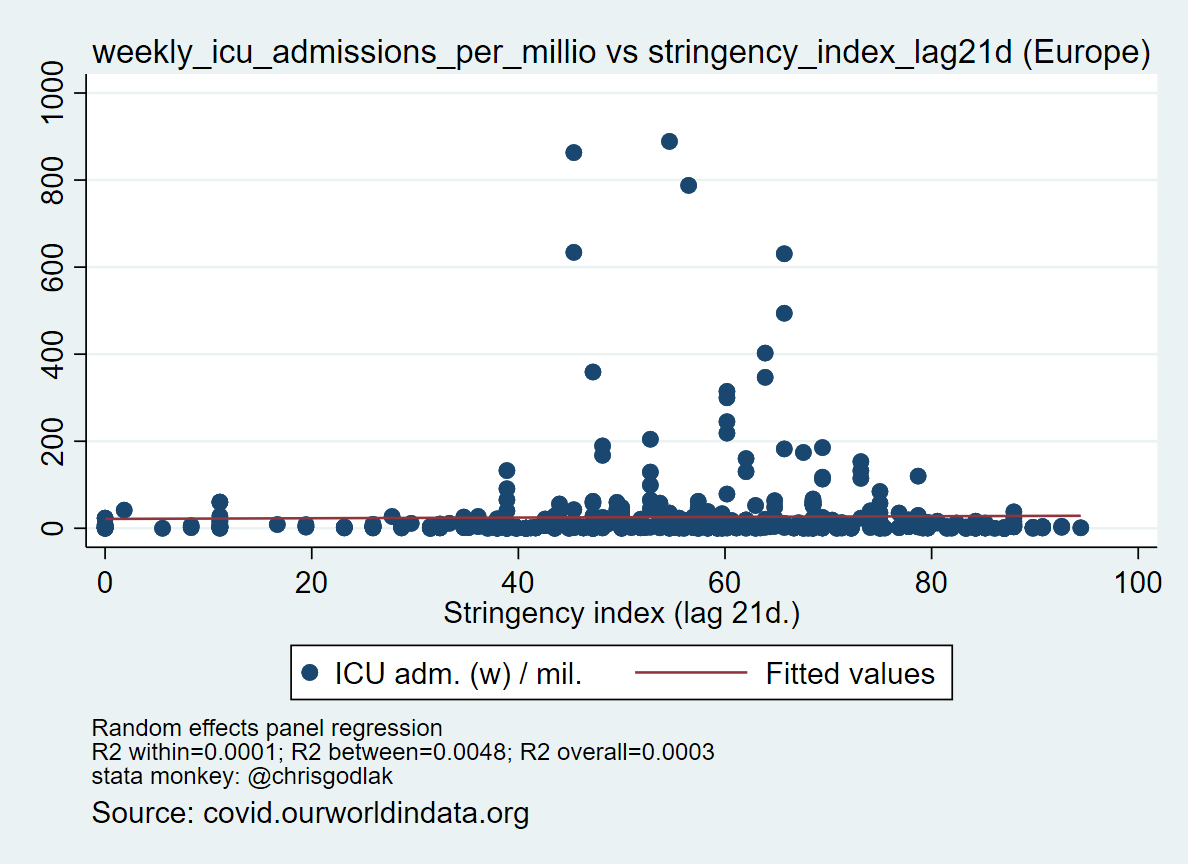
Weekly ICU admission / mil. vs Stringency index in Europe, R²=0.68%
R² drops to 0 again

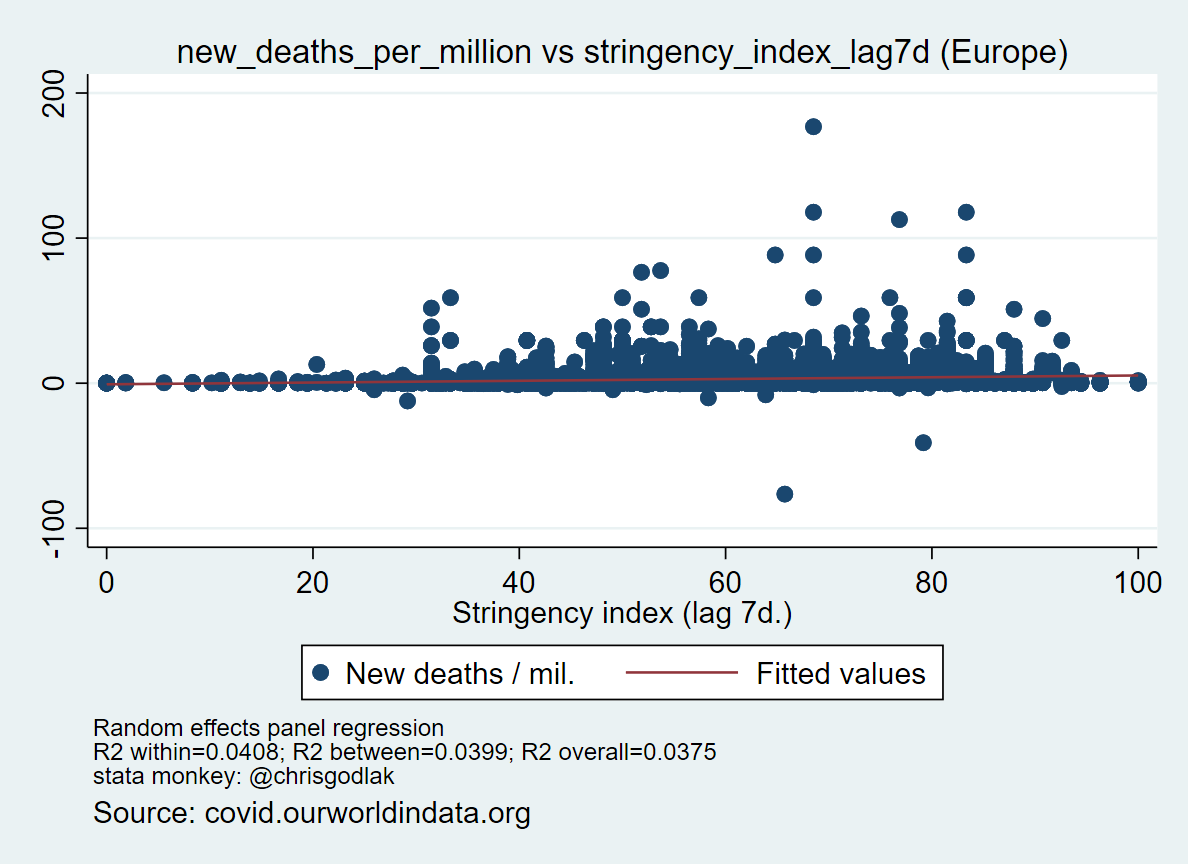
New deaths / mil. vs Stringency index in Europe, R²=4.76%
(notice it is the largest overall R² in the previous contemporaneous analysis)
R² drops with every lag, to reach 0.88%


Overall, using these metrics and focusing on R², expect the reproduction rate, all other ‘covid-19’ metrics become even less linearly related to stringency index over time; which confirms the need for more analysis if NPI are not eventually completely useless and do more harm if we consider society, economy, and so on…