
Stringency index vs deaths in Covid-19 Europe
All data come from covid.ourworldindata.org / focus on Europe

Following 2 previous posts on these things (part 1 and part 2) this is kind of a part 3 but with a focus on deaths only.
I was also somehow motivated to get back to this following this type of information:


So let’s dive in again !
I will use the average stringency index and the logs of daily difference in new deaths and total deaths per million respectively for all Europe countries.
First simple curves:
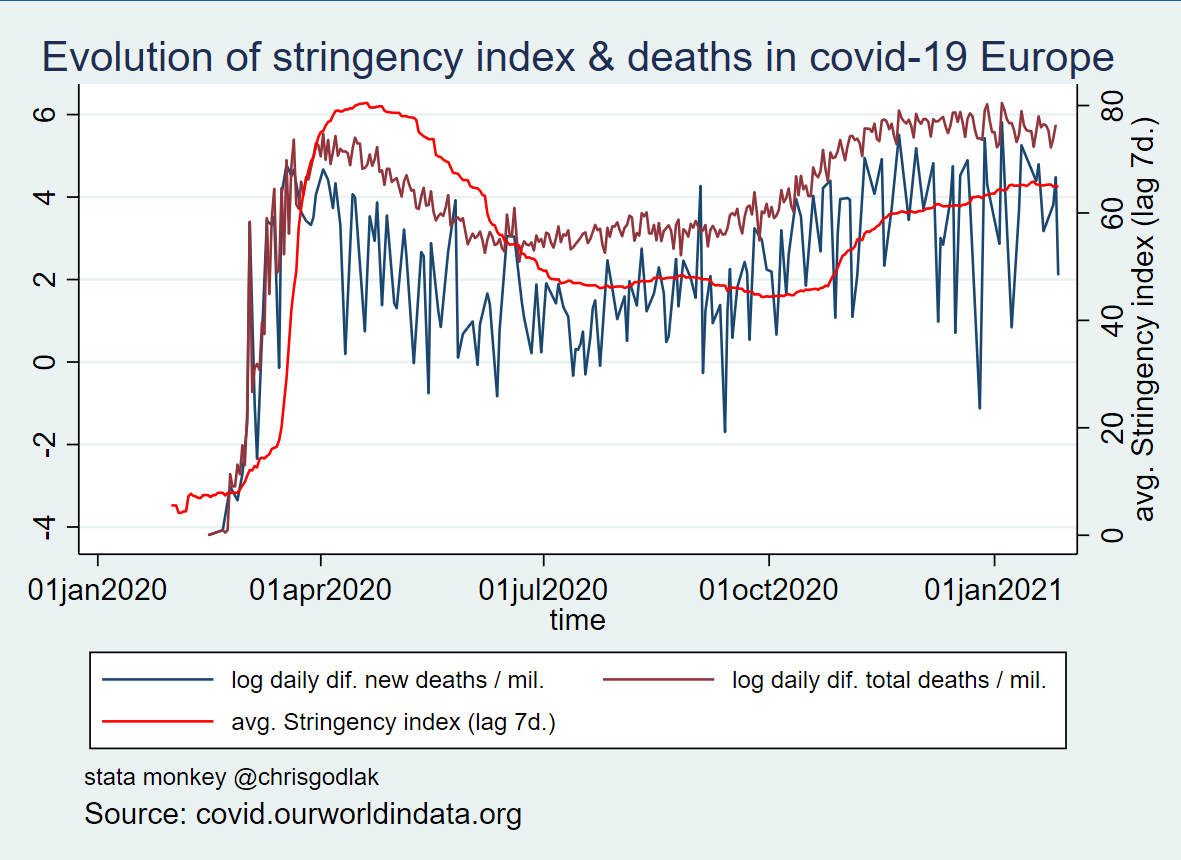
Looks like they evolve in “harmony”… more deaths associated with higher stringency index ? higher stringency index associated with more deaths ?
Now let get back to panel data and perform panel regressions (country-day dimensions) where death is a function of stringency.
I use 4 differents lags for stringency index (7, 14, 21 and 30 days).
Results for log of daily variations in new deaths per million:

Overall R² are low: 3.30% to 0; notice linear fit goes up with stringency for lower lags ! Then becomes flat…
Results for log of daily variations in total deaths per million:

Similar to new deaths: overall R² low but 2x larger than previously, then goes to 0 with longer lags.
I also did the same analysis with log of weekly variations in new and total deaths per million; all graphs here: https://icedrive.net/1/a8zLi1MpsR
Results are very similar
EDIT: i also add the following analysis
Rolling window (over 30 days periods) regressions of Europe average stringency index (lagged by 14 days) (X) on log of daily difference in new (total) deaths / mil (Y1 and Y2)
Solid black line is the coefficient (i.e. sensitivity of Y1 or Y2 to X); dashed gray line is the t-stat and the 2 red dash horizontal lines give the critical value (2) for the significance of the coefficient: if t-stat line above or below these red lines then coefficient beta is significant

Coefficient is oscillating mostly around 0 and is rarely even significant… There is a peak in spring and it is positive ! meaning a positive link between new deaths evolution and stringency ! Only 3 small but 2 significant only: in august and october (i.e. link is negative). Also 3 to 4 peaks in may, september, november and december but not significant…

Coefficient is even more oscillating around 0 and is rarely even significant… However significance is more consistent over the whole period; notice peaks at beginning and also in may and october (i.e. positive link between deaths and stringency…).